AI Visibility Tracker in a Spreadsheet: Free Template and Method
Before you pay for a tracker, run one for free. The template, the weekly loop, and the point where a sheet stops being enough.
Yes, you can run an AI visibility tracker in a spreadsheet, and for most teams it is the right first step. Fix a prompt list, run each prompt three times on three engines, log one row per answer, and compute four numbers. The template below does exactly that. It is also, honestly, the manual version of what CitePatch runs for you across 7 engines — so this guide tells you how to do it by hand, and exactly when the hand-made version stops paying for itself.
Who this is for
Founders, growth leads and SEO managers who have been asked “are we showing up in ChatGPT?” and do not yet have a budget line for it. If you already run a tracker and want to know whether a change you shipped moved an answer, read how to verify a change without overclaiming — that is a different job and a sheet is the wrong tool for it.
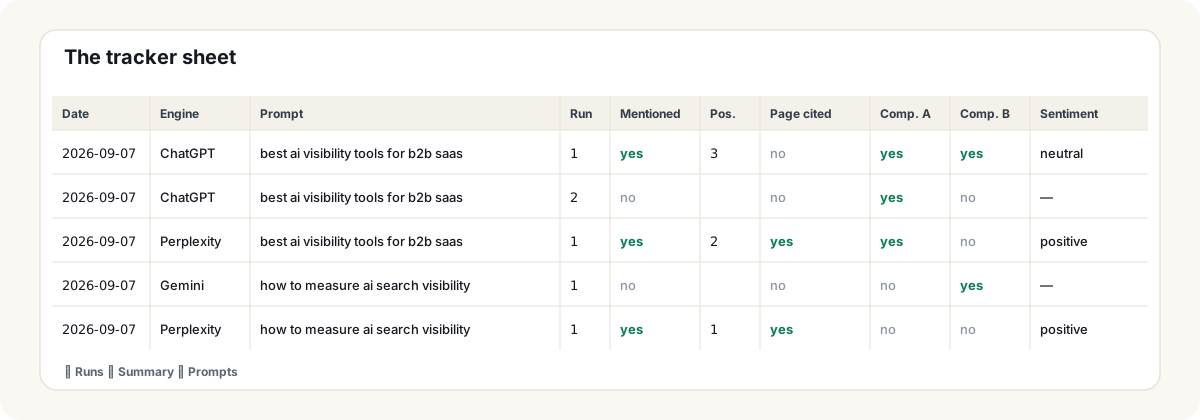
The columns
- date, engine, prompt, run — the key. Run is 1, 2 or 3 for the same prompt on the same engine on the same day.
- brand_mentioned —
yes/no. Named or clearly referred to; a link alone is not a mention. - position — 1, 2, 3… for where you appear in a list or comparison; blank if not mentioned.
- our_page_cited and cited_url — whether a page of yours appears in the sources, and which one.
- competitor_a/b/c_mentioned —
yes/nofor up to three named competitors. Fix the names before you start. - sentiment —
positive/neutral/negative, scored by one person with one rule. If two people log, drop the column. - notes — anything that surprised you. This column becomes your content backlog.
The weekly loop
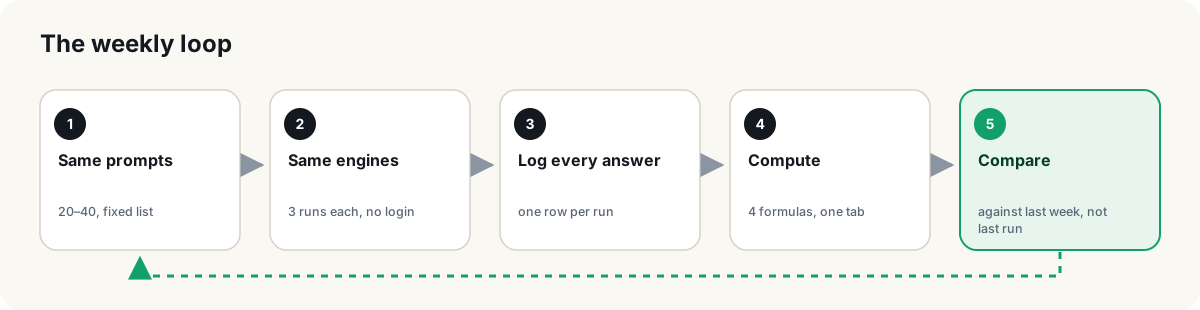
1. Fix the prompt list
Twenty to forty prompts your buyers actually type — category questions, comparisons, “best X for Y”, not “what is our brand”. Build it once with the commercial prompt universe method and do not edit it mid-quarter; a changed list makes every prior week incomparable.
2. Fix the engines and the conditions
Three engines is the practical ceiling for a manual loop — ChatGPT, Perplexity and Gemini cover most B2B buyers. Log out, or use a fresh session, so personalization does not leak in. Same day, same country, same device.
3. Log every answer, three runs each
One row per run. Do not average in your head, do not skip a run because the first two agreed. The third run is the one that tells you the first two were luck.
4. Compute four numbers on a Summary tab
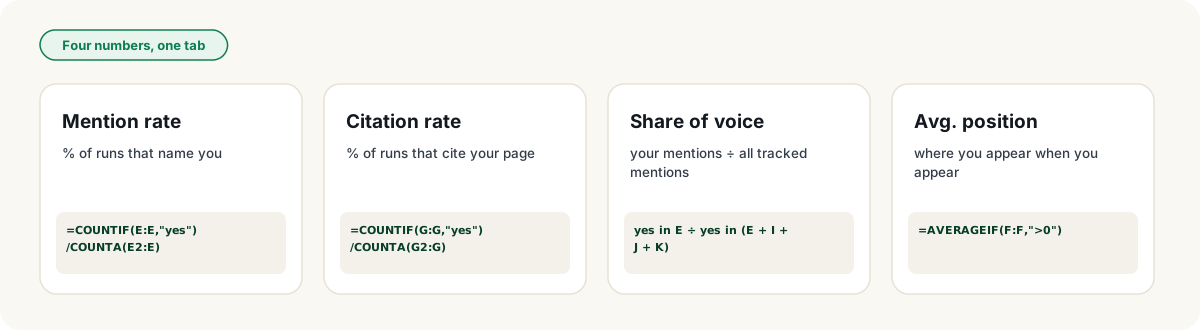
Share of voice in full, with the template’s columns (E = brand, I/J/K = competitors):
=COUNTIF(Runs!E:E,"yes") / (COUNTIF(Runs!E:E,"yes") + COUNTIF(Runs!I:I,"yes") + COUNTIF(Runs!J:J,"yes") + COUNTIF(Runs!K:K,"yes"))Filter each formula by engine or by prompt group with COUNTIFS when you want the breakdown. Keep the unfiltered number as the headline.
5. Compare against last week, not the last run
Copy the Summary numbers into a Weekly tab with the date. A move of a few points week to week is noise; a move that holds for three weeks is signal. That is the whole discipline.
Why three runs, not one
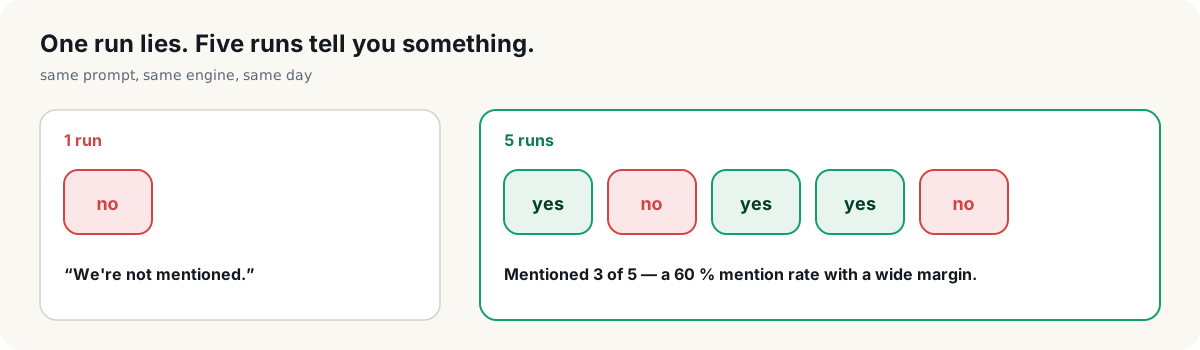
AI answers vary between runs. One run gives you a yes or a no; three give you a rate, and a rate is something you can compare next week. If a prompt matters to revenue, run it five times.
Where the spreadsheet holds — and where it breaks
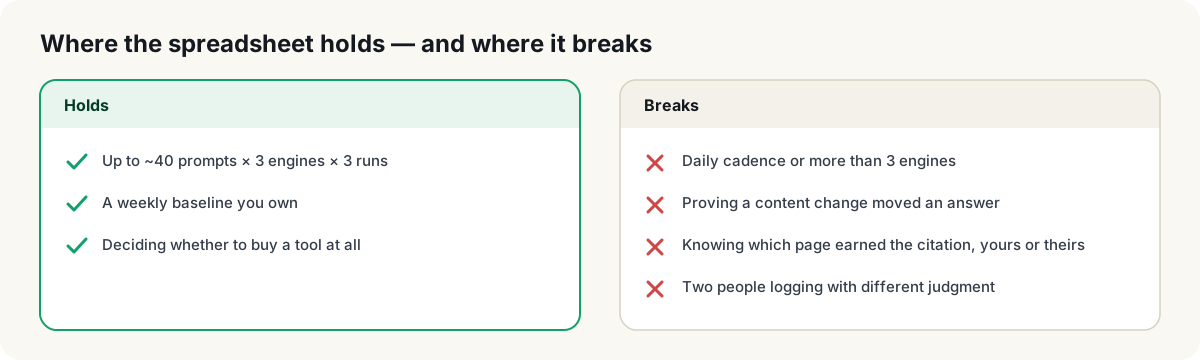
Forty prompts × three engines × three runs is 360 answers a week — around a working day of logging. That is fine for a quarter of baseline. It stops being fine when you want daily observation, when you add engines, when the person logging changes, or when someone asks the question the sheet cannot answer: did the page we changed cause that move? A sheet has no re-observation history and no dated record to compare against, so the honest answer from a spreadsheet is always “we don’t know”. The right-hand column is the job CitePatch was built for.
Common failures
What you get when you stop logging by hand
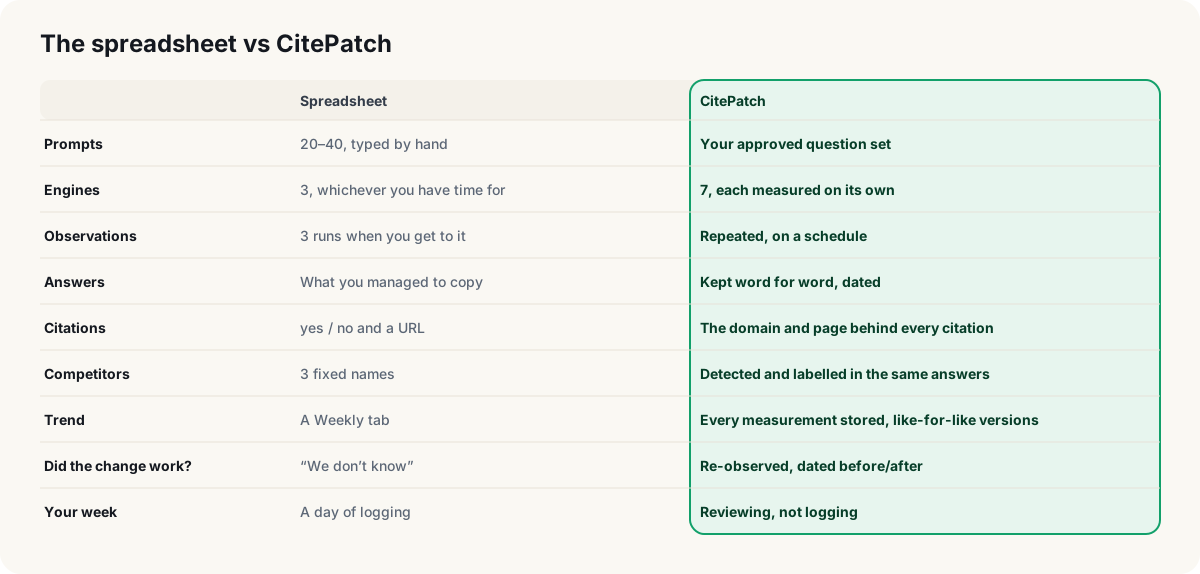
CitePatch is the loop above with the manual work removed and the evidence kept. Your approved question set runs across 7 engines on a schedule, each measured on its own, never averaged. Every answer is kept word for word with its date, and every citation is traced to the domain and page behind it — yours or a competitor’s — so you know which content is doing the work and which hole someone else’s page is filling. Competitors are detected in the same answers, not guessed separately. Every measurement is stored whole, so a trend line means the same thing from one week to the next.
Then it does what no spreadsheet can. When a page is missing or stale, Playbooks name the fix, propose the patch, and the Visibility Monitor keeps re-observing the same prompts after you ship it — so “did it work?” gets a dated before/after, not a shrug.
Next step
Download the template if you need to prove the case internally first. Run the free audit if you would rather see your numbers today. Either way, the first measurement is the one that makes the rest possible — take it this week.
Frequently asked questions
- Is there a free AI visibility tracker?
- Yes — a spreadsheet. With a fixed list of 20–40 prompts, three AI engines, three runs per prompt and one row per answer, four formulas give you mention rate, citation rate, share of voice and average position. This guide includes a CSV template you can open in Google Sheets or Excel.
- How many times should I run each prompt?
- At least three times per engine, in separate sessions, on the same day. AI answers vary between runs, so a single run tells you almost nothing. Three runs give you a rate instead of a yes/no; more runs narrow the margin.
- What should an AI visibility tracker measure?
- Four things, all computable from one row per answer: whether your brand was mentioned, whether one of your pages was cited, which competitors were mentioned alongside you, and where you appeared in the answer. Sentiment is worth a column too, but score it consistently or not at all.
- When does a spreadsheet tracker stop being enough?
- When you need daily cadence, more than three engines, several people logging, or evidence that a content change moved an answer. At that point the manual loop costs more than a tool, and the sheet cannot hold offsets or a dated re-observation history.
- What does CitePatch do that the spreadsheet cannot?
- It runs the same loop for you across 7 engines on a schedule, keeps every answer word for word with the page behind each citation, detects competitors in the same answers, and stores every measurement so trends compare like for like. And it answers the question a sheet never can — whether a change you shipped moved the answer — by keeping the Monitor's own dated before/after for the same questions.
- Can I track Google AI Overviews in the same sheet?
- Yes, as another engine row — but log them separately from AI Mode and from the assistants, because they behave differently and are triggered by search queries rather than conversational prompts.